[su_table responsive=”yes”]
Through the development of the Soil Health and Water Quality Whitepaper the Soil Health Nexus, with the help of a graphic designer, created several graphics to help communicate the foundations of soil health and the connection between soil health and water quality. Because these graphics can be utilized in many different educational settings, we are making them available to soil health educators across the region to use their programming.
| TITLE | SOURCE | RESOURCE TYPE AND DATE | SUMMARY/PREVIEW |
|---|---|---|---|
| The Carbon Cycle | The Soil Health Nexus | Extension Resource, April 2024 | 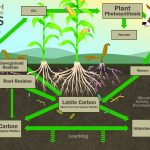 |
| The Water Cycle | The Soil Health Nexus | Extension Resource, April 2023 | 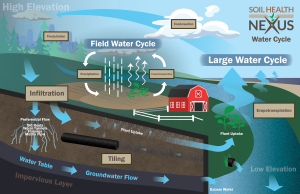 |
| The Nitrogen Cycle | The Soil Health Nexus | Extension Resource, April 2023 | 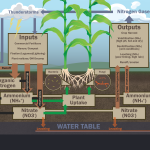 |
| Nitrogen contribution to crops from manures applied to soil | The Soil Health Nexus, adapted from Beauchamp, 1983 | Extension Resource, April 2023 | 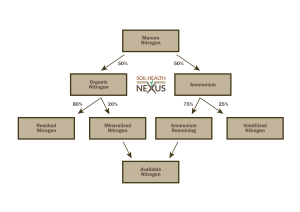 |
| Diagram demonstrating the connection between management practices and soil health, and between management and water quality | Soil Health Neuxs, Adapted from Zimnicki et al., 2020 | Extension Resource, April 2023 | 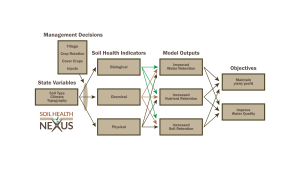 |
[/su_table]